CCTS Membership
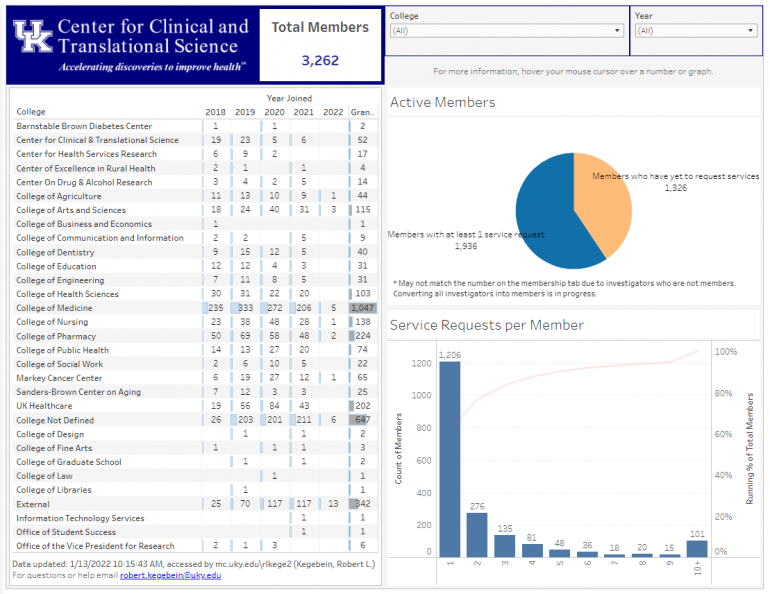
Establishing a membership model has been key to effectively tracking and coordinating our services. The chart and graphs below display the distribution of our membership across UK Colleges and breakdowns of service requests numbers.
Special Populations
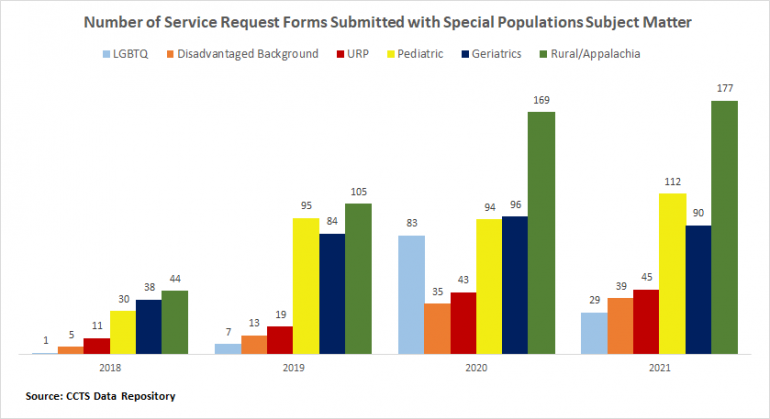
The following graphic displays the increase in number of CCTS service requests for support related to special populations from 2018 through 2021.
Data are extracted from the CCTS Membership service request forms are from September of 2018 to December 31, 2021.
Research Health Priority Areas
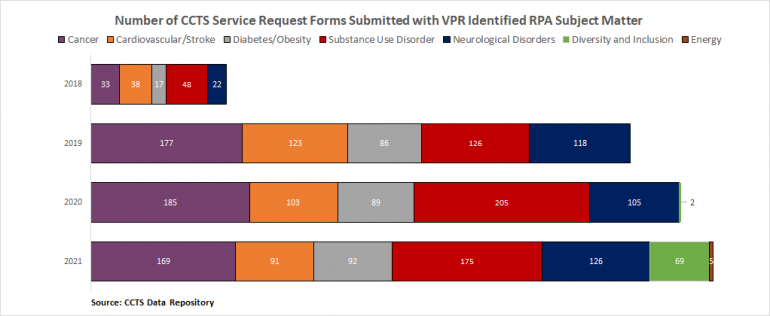
The University of Kentucky Vice President for Research has identified four health areas as priorities: 1) Cancer, 2) Obesity/Diabetes, 3) Cardiovascular/Stroke and 4) Substance Abuse. The following graphic gives the number of CCTS requests for service support for each category from 2018 through 2021.


